Using Excel to Run a t-test on the context of a Case Study of Inferential Statistics
The purpose of this study is to assess if there is a significant difference between web based and personal training for an IT program, based on the information collected from a sample.
The data was collected from 25 students undertaking different classes, some of which were web-based and some other had personal training. An average for both web-based and personal training grades was obtained and recorded. Also, other variables such as Education Level, Experience and Gender were recorded
The original data set is shown in the table below:
|
|
Grade - Web |
Grade - Personal |
Education Level |
Experience |
Gender | |
|
1 |
60% |
78% |
1 |
5 |
1 |
|
2 |
61% |
82% |
2 |
6 |
1 |
|
3 |
64% |
83% |
2 |
5 |
2 |
|
4 |
65% |
79% |
2 |
15 |
2 |
|
5 |
69% |
78% |
1 |
13 |
1 |
|
6 |
70% |
78% |
3 |
15 |
2 |
|
7 |
72% |
73% |
1 |
8 |
1 |
|
8 |
72% |
77% |
2 |
11 |
1 |
|
9 |
74% |
75% |
2 |
12 |
2 |
|
10 |
78% |
76% |
2 |
14 |
1 |
|
11 |
78% |
100% |
3 |
14 |
1 |
|
12 |
77% |
77% |
3 |
13 |
1 |
|
13 |
79% |
78% |
3 |
12 |
2 |
|
14 |
82% |
77% |
1 |
14 |
2 |
|
15 |
86% |
79% |
3 |
15 |
2 |
|
16 |
85% |
100% |
3 |
17 |
1 |
|
17 |
89% |
89% |
2 |
5 |
1 |
|
18 |
95% |
87% |
4 |
6 |
2 |
|
19 |
94% |
88% |
3 |
5 |
2 |
|
20 |
95% |
90% |
3 |
7 |
2 |
|
21 |
93% |
87% |
3 |
8 |
1 |
|
22 |
97% |
100% |
4 |
15 |
2 |
|
23 |
97% |
88% |
4 |
15 |
1 |
|
24 |
96% |
87% |
3 |
17 |
2 |
|
25 |
99% |
84% |
4 |
30 |
1 |
|
Education level |
Gender |
||||
|
1 - High School |
1 - Male |
||||
|
2 - College |
2 - Female |
||||
|
3 - University |
|||||
|
4 - Post Graduate |
|||||
Let's perform some statistical analyses. We first show the descriptive statistics
|
Summary Measures for Web Training | |
|
Mean |
0.8108 |
|
Standard Error |
0.03 |
|
Median |
0.79 |
|
Mode |
0.72 |
|
Standard Deviation |
0.13 |
|
Sample Variance |
0.02 |
|
Kurtosis |
-1.30 |
|
Skewness |
-0.11 |
|
Range |
39% |
|
Minimum |
60% |
|
Maximum |
99% |
|
Sum |
20.27 |
|
Count |
25 |
The mean score for Web Training is equal to
\[\bar{X}=\frac{1}{n}\sum{{{X}_{i}}}=\text{81}\text{.08 }\!\!%\!\!\text{ }\]and the standard deviation is equal to
\[s = \frac{1}{n-1}\sum{{{\left( {{X}_{i}}-\bar{X} \right)}^{2}}}=13%\]The data range from 60% to 99%.
· Now we show a summary for Personal Training
|
Summary Measures for Personal Training | |
|
Mean |
0.836 |
|
Standard Error |
0.016 |
|
Median |
0.820 |
|
Mode |
0.780 |
|
Standard Deviation |
0.079 |
|
Sample Variance |
0.006 |
|
Kurtosis |
0.065 |
|
Skewness |
0.912 |
|
Range |
27% |
|
Minimum |
73.0% |
|
Maximum |
100% |
|
Sum |
20.9 |
|
Count |
25 |
The mean score for Personal Training is equal to
\[\bar{X}=\frac{1}{n}\sum{{{X}_{i}}}=\text{83}\text{.6 }\!\!%\!\!\text{ }\]and the standard deviation is equal to
\[s=\frac{1}{n-1}\sum{{{\left( {{X}_{i}}-\bar{X} \right)}^{2}}}=7.9%\]The data range from 73% to 100%.
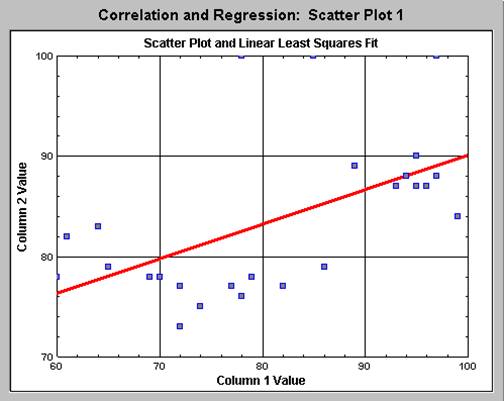
Correlation Analysis: Let's perform a correlation analysis between the variables Web-based training grade, and Personal Training grade. For this purpose, we display an output from Statdisk:
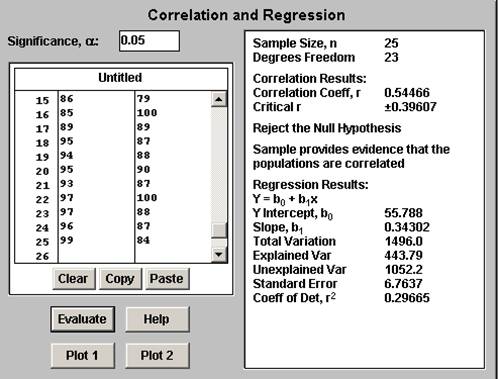
We observe that the correlation coefficient is equal to
\[R=0.54466\]Since the critical values for \(R\) are \(\pm 0.39607\), for a sample size of \(n=25\), we conclude that the correlation is significantly different from zero (positive). Also, we find that the coefficient of determination is equal to
\[{{R}^{2}}=0.29665\]which implies that approximately 29.665% of the variation in Personal Training grade is explained by Web-based training grade.
Histograms: The following histograms correspond to Web and Personal Training Scores
There shape of the histograms is mildly normal (bell-shaped), but we need further analysis to determine whether variables are normally distributed or not.
To this end, we use Minitab to perform a normality test. The results are shown in the diagram shown below
The p-value for test is 0.082, which is less than the significance 0.05. This means that we fail to reject the null hypothesis of normality.
Confidence Interval: We have that the 95% confidence interval for \({{\mu }_{D}}\) is given by
\[ CI=\left( \bar{D}-{{t}_{c}}\times \frac{{{s}_{D}}}{\sqrt{n-1}},\text{ }\bar{D}+{{t}_{c}}\times \frac{{{s}_{D}}}{\sqrt{n-1}} \right) = \left( 3-2.064\times \frac{10.57}{\sqrt{24}},\text{ }3+2.064\times \frac{10.57}{\sqrt{24}} \right) \] \[ =\left( -1.45327,\text{ }7.45327 \right) \]This means that there's a 95% probability that this interval contains the actual population mean difference \({{\mu }_{D}}\).
Inferential Statistics: Our purpose is to determine if there is a significant difference between web based and personal training. Since we have paired samples our objective is twofold:
- Use hypothesis testing to determine whether the mean difference between the scores is significantly different from zero.
- Use the sample data to construct a confidence interval to estimate \({{\mu }_{D}}\), the population mean difference \({{\mu }_{D}}\) of the scores.
First, we need the table with the difference between the scores
|
Grade - Web |
Grade - Personal |
Difference$(D)$ | |
|
1 |
60% |
78% |
18% |
|
2 |
61% |
82% |
21% |
|
3 |
64% |
83% |
19% |
|
4 |
65% |
79% |
14% |
|
5 |
69% |
78% |
9% |
|
6 |
70% |
78% |
8% |
|
7 |
72% |
73% |
1% |
|
8 |
72% |
77% |
5% |
|
9 |
74% |
75% |
1% |
|
10 |
78% |
76% |
-2% |
|
11 |
78% |
100% |
22% |
|
12 |
77% |
77% |
0% |
|
13 |
79% |
78% |
-1% |
|
14 |
82% |
77% |
-5% |
|
15 |
86% |
79% |
-7% |
|
16 |
85% |
100% |
15% |
|
17 |
89% |
89% |
0% |
|
18 |
95% |
87% |
-8% |
|
19 |
94% |
88% |
-6% |
|
20 |
95% |
90% |
-5% |
|
21 |
93% |
87% |
-6% |
|
22 |
97% |
100% |
3% |
|
23 |
97% |
88% |
-9% |
|
24 |
96% |
87% |
-9% |
|
25 |
99% |
84% |
-15% |
|
Average \((\bar{D})\) |
3% | ||
|
St. Dev \(({{s}_{D}})\) |
10.57% |
We need to perform a paired t-test to determine whether the difference is statistically significant or not. We want to test the following hypotheses:
\[\begin{array}{cc} & {{H}_{0}}:{{\mu }_{D}}=0 \\ & {{H}_{A}}:{{\mu }_{D}}\ne 0 \\ \end{array}\]- Assumptions: In order to apply the t-test we need to show that the differences are normally distributed. We tested for normality at the 0.05 significance level, and we found that we cannot reject the null hypothesis of normality at the 0.05 significance level.
We compute the t-test statistics as
\[t = \frac{\bar{D}-{{\mu }_{D}}}{{{s}_{D}}/\sqrt{n-1}}=\frac{3-0}{10.57/\sqrt{24}} = 1.390439\]The critical value for the two-tailed t-distribution, with 24 degrees of freedom, for \(\alpha =0.05\), is equal to
\[{{t}_{c}}=2.064\]
Remarks:
- The sample size is not big enough to approximate by a normal distribution. It would be recommended to increase the sample size.
You can send you Excel Stats homework problems for a Free Quote. We will be back shortly (sometimes within minutes) with our very competitive quote. So, it costs you NOTHING to find out how much would it be to get step-by-step solutions to your Stats homework problems.
Our experts can help YOU with your Statistics Assignments. Get your FREE Quote..