Excel to Conduct a t-test for Two Samples - Statistics HW Help
|
Solution
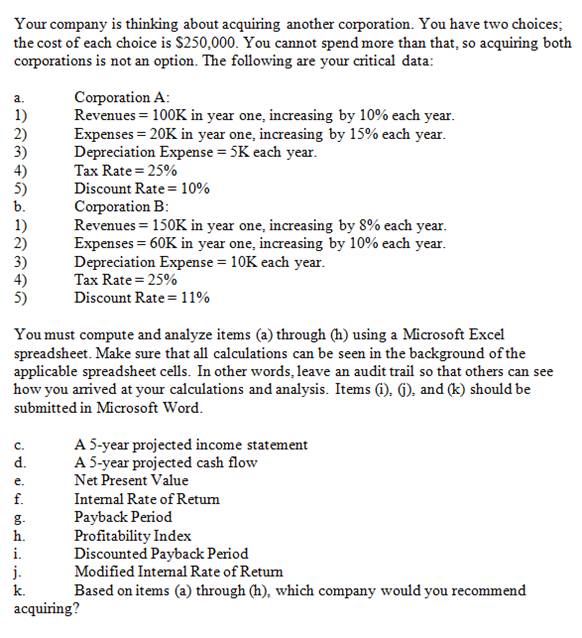
Our objective is to evaluate two mutually exclusive options, which are buying corporation A or buying corporation B. We have the information about yearly cash flows, and consequently, we have to organize all the information in tables and do all the appropriate calculations.
c. We have to compute a 5-year projected income statement, which means we have to organize costs and benefits associated with the first 5 years of operation.
We show now the EXCEL tables for the 5-year projected income statement for Corporation A and B.
|
Corporation A |
||||||
|
Year 0 |
Year 1 |
Year 2 |
Year 3 |
Year 4 |
Year 5 | |
|
Revenues |
0 |
100,000 |
110,000 |
121,000 |
133,100 |
146,410 |
|
Expenses |
-250,000 |
-20,000 |
-22000 |
-24200 |
-26620 |
-29282 |
|
Depreciation |
0 |
-5,000 |
-5,000 |
-5,000 |
-5,000 |
-5,000 |
|
Earning before taxes |
-250,000 |
75,000 |
83,000 |
91,800 |
101,480 |
112,128 |
|
Taxes |
0 |
-18750 |
-20750 |
-22950 |
-25370 |
-28032 |
|
Net Income |
-250,000 |
56,250 |
62,250 |
68,850 |
76,110 |
84,096 |
|
Corporation B |
||||||
|
Year 0 |
Year 1 |
Year 2 |
Year 3 |
Year 4 |
Year 5 | |
|
Revenues |
0 |
150,000 |
162000 |
174960 |
188956.8 |
204073.344 |
|
Expenses |
-250,000 |
-60,000 |
-66000 |
-72600 |
-79860 |
-87846 |
|
Depreciation |
0 |
10,000 |
10,000 |
10,000 |
10,000 |
10,000 |
|
Earning before taxes |
-250,000 |
100,000 |
106,000 |
112,360 |
119,097 |
126,227 |
|
Taxes |
0 |
-25000 |
-26500 |
-28090 |
-29774.2 |
-31556.836 |
|
Net Income |
-250,000 |
75,000 |
79,500 |
84,270 |
89,323 |
94,671 |
(Year 0 on the last tables means initial outlay).
d. We have to compute a 5-year projected cash flow, which means we have to organize costs and benefits associated with the first 5 years of operation considering the specific times where the flows occur. We show now the EXCEL tables with the cash flow for both Corporation A and Corporation B:
|
Projected Cash - Flow |
||||||
|
Corporation A |
||||||
|
Year 0 |
Year 1 |
Year 2 |
Year 3 |
Year 4 |
Year 5 | |
|
Revenues |
0 |
100,000 |
110,000 |
121,000 |
133,100 |
146,410 |
|
Expenses |
-250,000 |
-20,000 |
-22000 |
-24200 |
-26620 |
-29282 |
|
Depreciation |
0 |
-5,000 |
-5,000 |
-5,000 |
-5,000 |
-5,000 |
|
Loss previous period |
0 |
-250,000 |
0 |
0 |
0 |
0 |
|
Earnings before taxes |
-250,000 |
75,000 |
83,000 |
91,800 |
101,480 |
112,128 |
|
Taxable income |
-250,000 |
-175,000 |
83,000 |
91,800 |
101,480 |
112,128 |
|
Taxes |
0 |
0 |
20750 |
22950 |
25370 |
28032 |
|
Net Income |
-250,000 |
75,000 |
103,750 |
114,750 |
126,850 |
140,160 |
|
Discounted Net Income |
-250000 |
68181.8182 |
85743.8017 |
86213.3734 |
86640.2568 |
87028.3326 |
|
Corporation B |
||||||
|
Year 0 |
Year 1 |
Year 2 |
Year 3 |
Year 4 |
Year 5 | |
|
Revenues |
0 |
150,000 |
162000 |
174960 |
188956.8 |
204073.344 |
|
Expenses |
-250,000 |
-60,000 |
-66000 |
-72600 |
-79860 |
-87846 |
|
Depreciation |
0 |
10,000 |
10,000 |
10,000 |
10,000 |
10,000 |
|
Loss previous period |
0 |
-250,000 |
0 |
0 |
0 |
0 |
|
Earnings before taxes |
-250,000 |
100,000 |
106,000 |
112,360 |
119,097 |
126,227 |
|
Taxable income |
-250,000 |
-150,000 |
106,000 |
112,360 |
119,097 |
126,227 |
|
Taxes |
0 |
0 |
26500 |
28090 |
29774.2 |
31556.836 |
|
Net Income |
-250,000.00 |
100,000.00 |
132,500.00 |
140,450.00 |
148,871.00 |
157,784.18 |
|
Discounted Net Income |
-250,000.00 |
90,090.09 |
107,539.97 |
102,695.83 |
98,065.94 |
93,637.23 |
e. We find now the NPV for both Corporation A and Corporation B. We have the formula:
\[NPV=\sum\limits_{t=0}^{n}{\frac{{{C}_{t}}}{{{(1+\alpha )}^{t}}}}\]where \({{C}_{t}}\) corresponds to the net cash flow associated to period t, and \(\alpha \) correspond to the discount rate.
Corporation A:
\[NPV_B = -250,000+68,181.82+85,743.80+86,213.37+87,028.33\]so therefore
\[NPV_A = \$163,807.58\]Corporation B:
\[NPV_A = -250,000+90,090.09+107,539.97+102,695.83+93,637.23\]so therefore
\[NPV_B = \$242,029.06\]f. Let’s compute now the internal rate of return IRR. Using EXCEL built in formulas we
find thatIRR Corporation A : 31%
IRR Corporation B : 42%
g. Now we compute the payback period. We have the following EXCEL tables
Corporation A: Payback period = 3.8231507 years
|
Initial Outlay |
-250,000 |
Cumulative |
||
|
Year 1 |
56,250 |
56,250 |
||
|
Year 2 |
62,250 |
118,500 |
||
|
Year 3 |
68,850 |
187,350 |
||
|
Year 4 |
76,110 |
263,460 |
||
|
Year 5 |
84,096 |
347,556 |
||
|
After 3rd year |
0.8231507 |
Payback |
3.8231507 years | |
Corporation B: Payback Period = 3.1257 years
|
Initial Outlay |
-250,000 |
Cumulative |
||
|
Year 1 |
75,000 |
75,000 |
||
|
Year 2 |
79,500 |
154,500 |
||
|
Year 3 |
84,270 |
238,770 |
||
|
Year 4 |
89,323 |
328,093 |
||
|
Year 5 |
94,671 |
422,764 |
||
|
After 3rd year |
0.1257235 |
Payback |
3.1257 years | |
h. Profitability index: We know
\[\text{Profitability Index = }\frac{\text{PV of Future Flows}}{\text{Initial Investment}}\]Corporation A:
Profitability Index = 1.655232
Corporation B:
Profitability Index = 1.968116
i. We have to do the same as for the payback period, except that the flows need to be discounted.
Corporation A: Discounted Payback Period = 4.837 years
|
Initial Outlay |
-250,000 |
Cumulative |
||
|
Year 1 |
51,136 |
51,136 |
||
|
Year 2 |
51,446 |
102,582 |
||
|
Year 3 |
51,728 |
154,310 |
||
|
Year 4 |
51,984 |
206,294 |
||
|
Year 5 |
52,217 |
258,511 |
||
|
After 4th year |
0.8370071 |
Payback |
4.837 years | |
Corporation B: Discounted Payback Period = 3.9567 years
|
Initial Outlay |
-250,000 |
Cumulative |
||
|
Year 1 |
67,568 |
67,568 |
||
|
Year 2 |
64,524 |
132,092 |
||
|
Year 3 |
61,617 |
193,709 |
||
|
Year 4 |
58,840 |
252,549 |
||
|
Year 5 |
56,182 |
308,731 |
||
|
After 3rd year |
0.95667913 |
Payback |
3.9567 years | |
j. Modified Internal Rate of Return: Here we assume that the reinvestment is equal to the discount rate. Using EXCEL built in formula we get
MIRR Corporation A : 22%
MIRR Corporation B : 27%
k. Based on the previous analysis and results, we would recommend acquiring Corporation B.
You can send you Excel Stats homework problems for a Free Quote. We will be back shortly (sometimes within minutes) with our very competitive quote. So, it costs you NOTHING to find out how much would it be to get step-by-step solutions to your Stats homework problems.
Our experts can help YOU with your Statistics Assignments. Get your FREE Quote.