Community
SPSS Tutorial 2 - Linear Regression
In this week's tutorial, we are going to be covering the topic of Linear Regression with SPSS. See below a list of relevant sample problems, with step by step solutions.
We hope you will find them useful. We share full tutorials, tips and hints, with the members of our community. Please do not hesitate to contact us if you any questions.
Sample Linear Regression with SPSS problems
Question 1: A multimedia statistics learning system includes a test of skill in using the computer’s mouse. The software displays a circle at a random location on the computer screen. The subject tries to click in the circle with the mouse as quickly as possible. A new circle appears as soon as the subject clicks the old one. The usability_test.xls file contains data for two variables: DISTANCE and TIME. DISTANCE is the distance from the cursor location to the center of the new circle, in units whose actual size depends on the size of the screen. TIME is the time required to click in the new circle, in milliseconds. Data were collected for 10 subjects, where each subject clicked 15 times.
We suspect that time depends on distance. Download the usability_test.xls data from the course documents for module 3. Use SPSS to compute the following analysis –
(a) Identify the response variable and the independent variable in this study
(b) Make a scatterplot of time against distance. Describe the pattern in the plot.
(c) Does the scatterplot display any outliers?
(d) Compute the correlation coefficient between distance and time, and draw conclusions on the strength of the association between the two variables.
Solution: (a) The independent variable is Distance, and the dependent variable is Time.
(b) The following scatterplot is obtained:
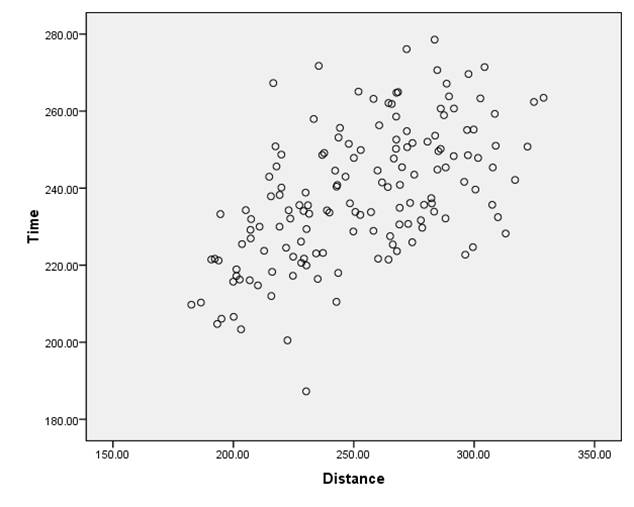
The scatterplot above shows a moderate degree of positive linear association between distance and time.
(c) There are no clear outliers (even though we would need to perform some formal test or to analyze the residuals in a regression to assess categorically whether or not there are outliers.
(d) The following is obtained:
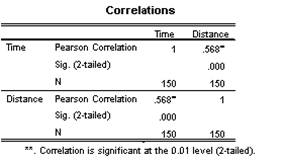
The correlation between the two variables is r = 0.568 (which is significantly different from zero, p < .001), which confirms what is found visually, in terms that the two variables have a moderate positive degree of linear association.
Question 2: Refer again to the Species data.
(a) Create two new variables, LnBody—which is the natural log of BodyWeight and LnBrain—which is the natural log of BrainWeight. Obtain a scatterplot of LnBrain against LnBody. Comment on the relationship between these two new variables. How does this graph compare with the one you obtained in the last question?
(b) Obtain the regression line relating LnBrain to LnBody, saving the leverages, the studentized deleted residuals, and the Cook’s distances. Comment on the values of these three measures for the three ‘unusual’ species.
(c) Use the regression line you obtained in part (b) to predict the brain weight for an adult horse. The average weight of an adult horse is 450 kilograms.
(d) Check the validity of the three conditions for inference in your model in part (b).
Solution: (a) The following is obtained:
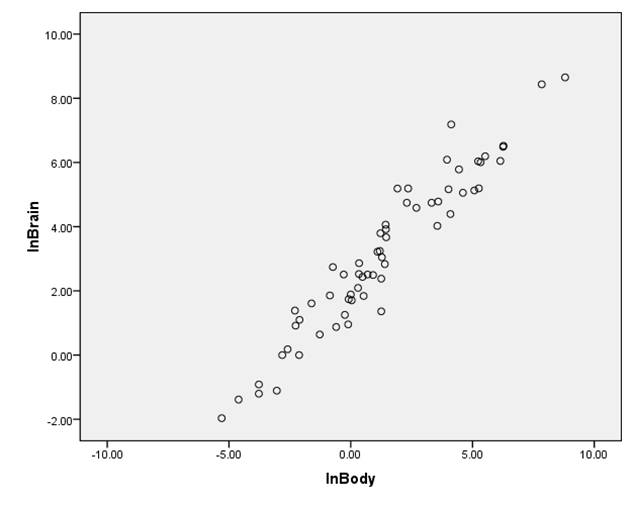
Now we observe a rather strong positive degree of positive linear association, with no strong outliers apparently.
(b) The following is obtained:
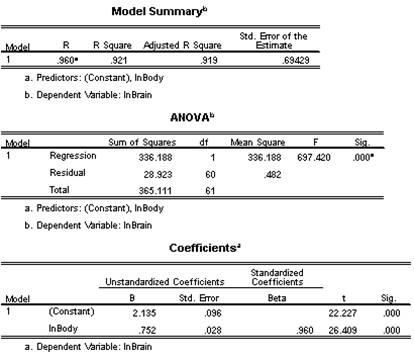
The regression model is
LnBrain = 2.135 + 0.752*LnBody
The model is significant overall, F = 697.420, p < .001, and it explains 92.1% of the variation in LnBrain.
The following is obtained:
![]()
![]()
![]()
Now, the “unusual” points are neither outliers nor influential points.
(c) We get:Ln(Brain) = 2.135 + 0.752*Ln(450) = 6.729154182
which means that the predicted brain weight is 836.44 grams.
(d) The assumption is linearity seems to be met, based on the clear linear pattern exhibited by the scatterplot of ln(Brain) and ln(Body). The following residual plots are obtained:
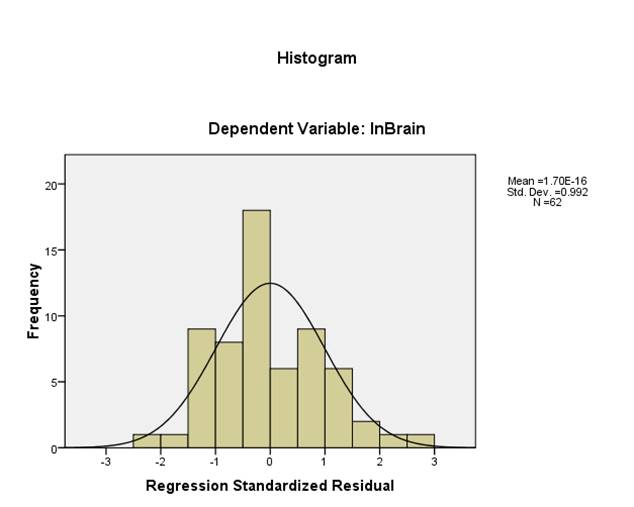
The histogram of residuals above shows that there is not a strong departure from normality.
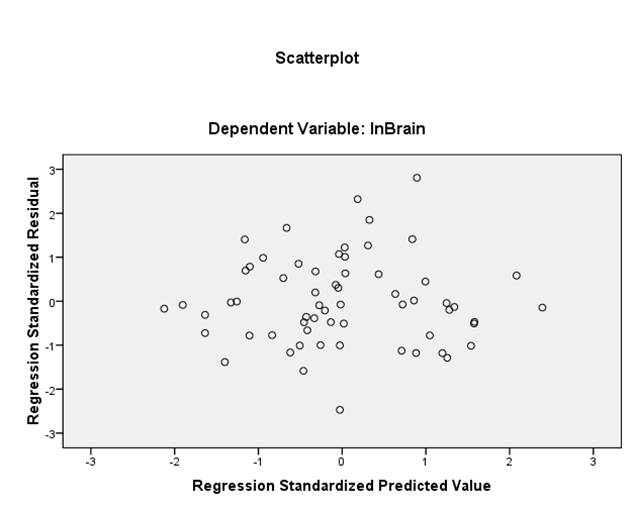
The plot of residuals versus predicted values doesn’t show any clear pattern suggesting a problem with heteroskedasticity.
Hence, the regression assumptions seem to be met.
|