Minitab Help - Learn All the Steps Necessary to Run a Linear Regression Analysis with Minitab
- Minitab is a powerful Statistical software package with a very intuitive graphical interface. In Unit 3 you tested 2 different sets of hypotheses using the database from Unit 1. Provide a summary of your findings. Address each hypothesis you tested.
Solution: We were interested in testing
\[\begin{array}{cc} & {{H}_{0}}:{{\mu }_{M}}={{\mu }_{F}} \\ & {{H}_{1}}:{{\mu }_{M}}\ne {{\mu }_{F}} \\ \end{array}\]where the parameter \({{\mu }_{M}}\) corresponds to mean tenure for males and \({{\mu }_{F}}\) corresponds to mean tenure for females.
 Need Help with Minitab? We can help! Your satisfaction is guaranteed. Our rate starts at $35/hour. Free quote in hours. Quick turnaround! Need Help with Minitab? We can help! Your satisfaction is guaranteed. Our rate starts at $35/hour. Free quote in hours. Quick turnaround! |
Minitab T-test results
Using a t-test (two-tailed) for an unknown population variance, we tested the null hypothesis. The sample size is large enough (\(n=288\)), so we approximated by the standard normal distribution.
The critical values for this test are \(\pm 1.96\). Using the dataset from Unit we got the following results.
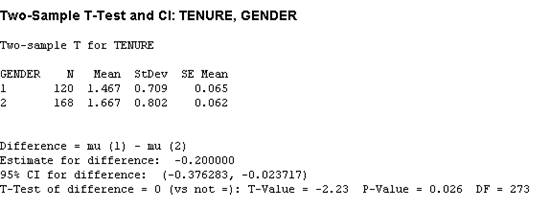
The t-value was \(t=-2.23\), and the critical t- values were \(\pm 1.96\). We therefore rejected the null hypothesis.
We also tested if the real mean intrinsic satisfaction is equal to 5. The hypothesis we tested was
\[\begin{array}{cc} & {{H}_{0}}:{{\mu }_{I}}=5 \\ & {{H}_{1}}:{{\mu }_{I}}\ne 5 \\ \end{array}\]One sample t-test
We also used a two tailed t-test. We got the following results:
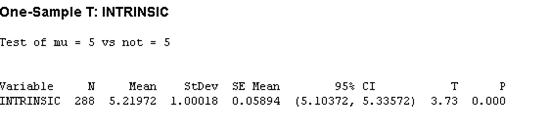
From the table provided by Minitab we see that the t-statistics is 3.73, and again the critical t-value is \(\pm 1.96\). Therefore, we rejected the null hypothesis. We concluded that the mean intrinsic satisfaction is different from 5.
- In Unit 4 you researched the topic on Job Satisfaction. Provide a one page summary of your research findings. Are your findings consistent with what you observed when you tested your hypotheses in the Unit 3 assignment?
Solution: In Unit 4 we studied some of the reason employees have to quit their current jobs. From 12,823 people, 8,335 employees (65%) responded that they expected to be looking for a new job in the next 3 months.
- 57.3% (5,062) said the primary reason was because they believe they were underpaid
- Within this group, 1,624 employees provided details of their current job and salary
- Considering current market rates, only 18.7% were actually underpaid.
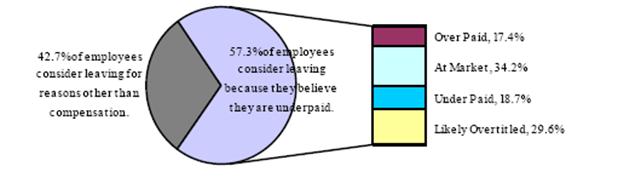
This gives a hint that job dissatisfaction comes probably from different factors, but it's a very common thing for the employees to feel that they're underpaid instead.
Source: Salary.com
- Work through a simple regression calculation using intrinsic job satisfaction and extrinsic job satisfaction. You are more than welcome to select thirty data points from our Unit 1 data set to use for each group. You are also welcome to decide which group you want to make the dependent variable and which the independent variable. The final answer will then be a complete model equation resembling: Y = bx + a
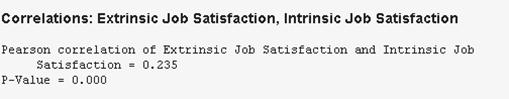
Solution: First of all, we need to check whether the correlation is significantly different from zero. We use the whole sample (288 observations). Using Minitab we obtain
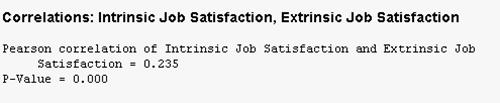
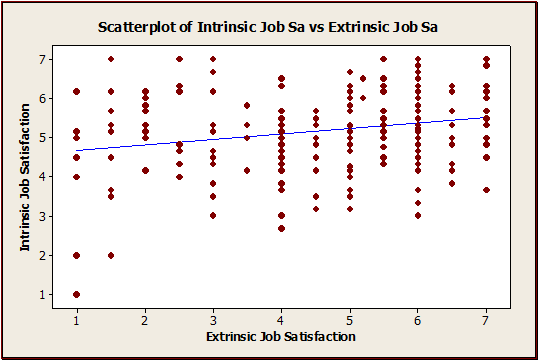
The correlation coefficient is equal to \(R=0.235\). The p-value is equal to 0.000, which is less than 0.05. That implies that the correlation is significantly different from zero. Let's take a look at the scatterplot:
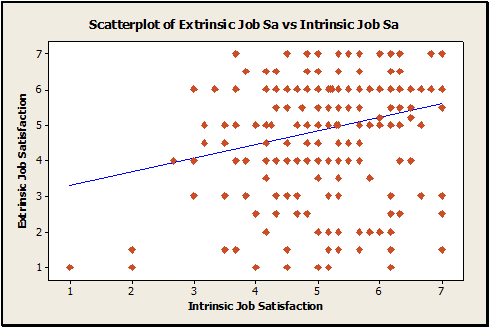
The scatterplot shows that the data is all spread out. So, the correlation coefficient is significantly different from zero, but the strength of the linear association is extremely
weak.In fact, the coefficient of determination is \({{R}^{2}}=0.055225\), which means that only 5.52% of the variance in "Extrinsic Job Satisfaction" is accounted by the independent variable "Intrinsic Job Satisfaction"
The ANOVA table is shown below:
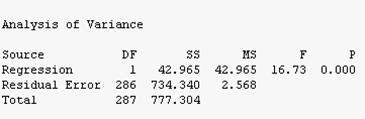
The significance is 0.000. This implies that the model is significant overall (not all the coefficients are zero)
Linear Regression Results obtained with Minitab
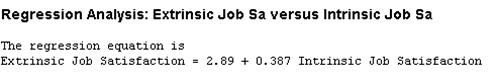
The equation regression is obtained by using Minitab:
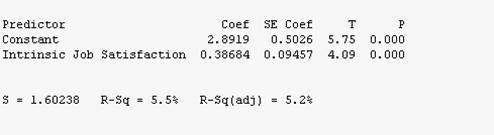
We see that "Intrinsic Job Satisfaction" is a significant predictor (\(p < .001\)).
The following linear regression equation is obtained with the aid of Minitab
\[Extrinsic=2.89+0.387\text{ }Intrinsic\]- Work through a second simple regression by switching the dependent and independent variables used in the first regression. Make very specific comments and give reasons regarding any similarities or differences in Multiple R and the ANOVA coefficients.
Solution: The objective of this part is to switch the dependent and independent variables used in the previous regression. This is easy using Minitab:
As expected, the correlation is EXACTLY THE SAME. The scatterplot is:
Regression Analysis:
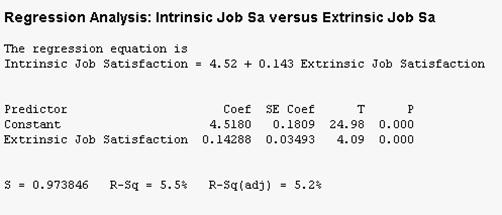
The table above shows that "Extrinsic Job Satisfaction" is a significant predictor of "Intrinsic Job Satisfaction". The regression equation is given by
\[Intrinsic = 4.52 + 0.143\text{ }Extrinsic\]The ANOVA table is shown below:
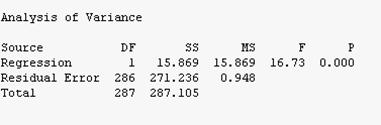
The F-statistics is EXACTLY THE SAME as the one we obtained in the last part.
Do you have any Minitab questions? Send us your Minitab problems for a Free Quote. We will be back shortly with our very competitive quote. So, it costs you NOTHING to find out how much would it be to get step-by-step solutions to your Stats homework problems.