Minitab is a great tool to conduct an in depth Time Series analysis - Minitab Help
Time Series Analysis
1. Print your modified data set on the answer sheet with your personal dataset changes highlighted in bold type and explain what you did (giving values for F,L, D and student number just below the dataset)
Solution: The modified dataset is shown below:
|
Year |
quarter 1 |
quarter2 |
quarter 3 |
quarter 4 |
| 1 |
66 |
155 |
100 |
40 |
| 2 |
103 |
187 |
154 |
77 |
| 3 |
144 |
265 |
233 |
124 |
| 4 |
199 |
289 |
253 |
186 |
| 5 |
222 |
340 |
289 |
215 |
| 6 |
241 |
365 |
308 |
276 |
 Need Help with Minitab? We can help! Your satisfaction is guaranteed. Our rate starts at $35/hour. Free quote in hours. Quick turnaround! Need Help with Minitab? We can help! Your satisfaction is guaranteed. Our rate starts at $35/hour. Free quote in hours. Quick turnaround! |
2. You may now wish to modify the dataset into two columns. The first column showing the year and quarter and the second column showing the sales for that period. You may also wish to generate a third column with the numbers 1 through 24 to denote the index number for each sales value.
Solution: As indicated, we present the data in the required format
|
Year / Quarter |
Sales |
Index |
|
1/1 |
66 |
1 |
|
1/2 |
155 |
2 |
|
1/3 |
100 |
3 |
|
1/4 |
40 |
4 |
|
2/1 |
103 |
5 |
|
2/2 |
187 |
6 |
|
2/3 |
154 |
7 |
|
2/4 |
77 |
8 |
|
3/1 |
144 |
9 |
|
3/2 |
265 |
10 |
|
3/3 |
233 |
11 |
|
3/4 |
124 |
12 |
|
4/1 |
199 |
13 |
|
4/2 |
289 |
14 |
|
4/3 |
253 |
15 |
|
4/4 |
186 |
16 |
|
5/1 |
222 |
17 |
|
5/2 |
340 |
18 |
|
5/3 |
289 |
19 |
|
5/4 |
215 |
20 |
|
6/1 |
241 |
21 |
|
6/2 |
365 |
22 |
|
6/3 |
308 |
23 |
|
6/4 |
276 |
24 |
Seasonal Indexes
3. Generate seasonal indexes for the four quarters using the method outlined in the text in Chapter 18-4 and/or in the excel spreadsheet for problem 26 of Chapter 18. This is available on mygateway. The seasonal indexes should be formatted to show 6 decimal places.
Solution: We use Minitab we obtain the following seasonal indices. We go to "Stat" -> "Time Series" -> "Decomposition", we select the Sales variable, and we select the "Multiplicative" model. The outcome, formatted to 6 decimals, is shown below
|
Year / Quarter |
Sales |
Index |
|
|
1/1 |
66 |
1 |
0.908087 |
|
1/2 |
155 |
2 |
1.347777 |
|
1/3 |
100 |
3 |
1.123660 |
|
1/4 |
40 |
4 |
0.620476 |
|
2/1 |
103 |
5 |
0.908087 |
|
2/2 |
187 |
6 |
1.347777 |
|
2/3 |
154 |
7 |
1.123660 |
|
2/4 |
77 |
8 |
0.620476 |
|
3/1 |
144 |
9 |
0.908087 |
|
3/2 |
265 |
10 |
1.347777 |
|
3/3 |
233 |
11 |
1.123660 |
|
3/4 |
124 |
12 |
0.620476 |
|
4/1 |
199 |
13 |
0.908087 |
|
4/2 |
289 |
14 |
1.347777 |
|
4/3 |
253 |
15 |
1.123660 |
|
4/4 |
186 |
16 |
0.620476 |
|
5/1 |
222 |
17 |
0.908087 |
|
5/2 |
340 |
18 |
1.347777 |
|
5/3 |
289 |
19 |
1.123660 |
|
5/4 |
215 |
20 |
0.620476 |
|
6/1 |
241 |
21 |
0.908087 |
|
6/2 |
365 |
22 |
1.347777 |
|
6/3 |
308 |
23 |
1.123660 |
|
6/4 |
276 |
24 |
0.620476 |
4. Adjust the seasonal indexes generated so that the 4 indexes add to a total of 4.000000 (to six decimal places).
Solution: The table above already shows the indexes in such a way that they add up to a total of 4.000000.
5. Generate a scatterplot of your modified dataset and also generate a scatterplot of your seasonally adjusted dataset.
Solution: The scatter plot for the modified dataset is shown below:
The seasonally adjusted dataset is shown below:
Now we show both graphs together for a comparative view:
6. Generate a simple linear regression of the form: (seasonally adjusted sales)= b0 +b1(time) where time is from 1 through 24. Note the regression must use seasonally adjusted sales, not the sales of your modified dataset.
Solution: We now perform a Regression Analysis to analyze the trend line associated to the dataset. We use Minitab to obtain
\[{{Y}_{t}}=74.5036+10.1430t\]
7. Prepare deseasonalized forecasts for year 7 quarters 1,2,3 and 4.
Solution: We evaluate the equation at \(t=25,26,26,28\). We obtain:
\[\begin{array}{cc} & t=25\Rightarrow Y=328.0786 \\ & t=26\Rightarrow Y=338.2216 \\ & t=27\Rightarrow Y=348.3646 \\ & t=28\Rightarrow Y=358.5076 \\ \end{array}\]8. Seasonalize your forecasts from #7 above.
Solution: We multiply the forecast from #7 by the seasonal indexes to get:
|
Deseasonalized |
Indexes |
Seasonalized | |
|
25 |
328.0786 |
0.908087 |
297.9239116 |
|
26 |
338.2216 |
1.347777 |
455.8472934 |
|
27 |
348.3646 |
1.123660 |
391.4433664 |
|
28 |
358.5076 |
0.620476 |
222.4453616 |
Time Series Analysis using Regression
9. Return to the dataset as given in Part A, step 2. Generate 3 dummy 0-1 indicator variables in order to define the individual seasons. Write the definition for seasons 1,2,3, and 4 in terms of the three dummy 0-1 indicator variables, S1, S2, S3. (Do not use the seasonalized dataset from Part B).
Solution: We define the seasons 1, 2, 3 and 4 using the dummy variables \({{S}_{1}},{{S}_{2}},{{S}_{3}}\) as shown below
· Season 1: \({{S}_{1}}=1,{{S}_{2}}=0,{{S}_{3}}=0\)
· Season 2: \({{S}_{1}}=0,{{S}_{2}}=1,{{S}_{3}}=0\)
· Season 3: \({{S}_{1}}=0,{{S}_{2}}=0,{{S}_{3}}=1\)
· Season 4: \({{S}_{1}}=0,{{S}_{2}}=0,{{S}_{3}}=0\)
The table with the data is
|
Sales |
Time ($t$) |
${{S}_{1}}$ |
${{S}_{2}}$ |
${{S}_{3}}$ |
|
66 |
1 |
1 |
0 |
0 |
|
155 |
1 |
0 |
1 |
0 |
|
100 |
1 |
0 |
0 |
1 |
|
40 |
1 |
0 |
0 |
0 |
|
103 |
2 |
1 |
0 |
0 |
|
187 |
2 |
0 |
1 |
0 |
|
154 |
2 |
0 |
0 |
1 |
|
77 |
2 |
0 |
0 |
0 |
|
144 |
3 |
1 |
0 |
0 |
|
265 |
3 |
0 |
1 |
0 |
|
233 |
3 |
0 |
0 |
1 |
|
124 |
3 |
0 |
0 |
0 |
|
199 |
4 |
1 |
0 |
0 |
|
289 |
4 |
0 |
1 |
0 |
|
253 |
4 |
0 |
0 |
1 |
|
186 |
4 |
0 |
0 |
0 |
|
222 |
5 |
1 |
0 |
0 |
|
340 |
5 |
0 |
1 |
0 |
|
289 |
5 |
0 |
0 |
1 |
|
215 |
5 |
0 |
0 |
0 |
|
241 |
6 |
1 |
0 |
0 |
|
365 |
6 |
0 |
1 |
0 |
|
308 |
6 |
0 |
0 |
1 |
|
276 |
6 |
0 |
0 |
0 |
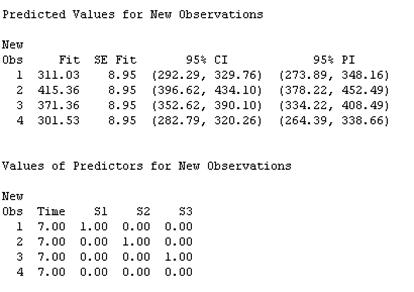
10. Generate a multiple regression of the form sales= b0 +b1(time)+ b2(S1) +b3(S2) +b4(S3). Comment on the suitability of the regression model by analyzing the F statistic, the 4 p-values for the coefficients b1,b2,b3,b4. Also review the residuals, outliers, residual plots, etc. Interpret the meaning of coefficients b2,b3 and b4.
Solution: The output we get from Minitab is
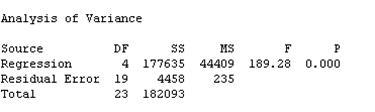
Overall, the model is significant ( p = 0.000 ).
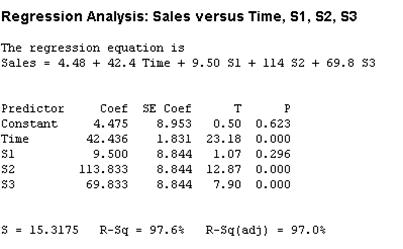
The p-values are all 0.000 except for \({{S}_{1}}\)'s p-value, which is 0.296. This means that the coefficient of the dummy variable \({{S}_{1}}\) is not significantly different from zero. The coefficients \({{\beta }_{2}},{{\beta }_{3}},{{\beta }_{4}}\) represent the average marginal amount of sales of the seasons 1, 2 and 3, with respect to season 4.
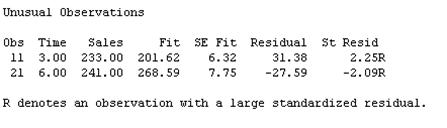
The summary for the residual is shown below:
There's a few outliers summarized in the table below.
11. Calculate the Durbin Watson statistic. Is autocorrelation (positive or negative) present?
Solution: The Durbin-Watson statistics is 1.64206. Since \({{d}_{L}}=1.04,\text{ }{{d}_{U}}=1.77\), we neither reject nor accept the null hypothesis of no-autocorrelation. The residuals visually have a very mild autocorrelation trend.
12. Prepare forecasts for year 7 quarters 1,2,3 and 4.
Solution: We use Minitab to obtain the following predictions:
Exponential Smoothing
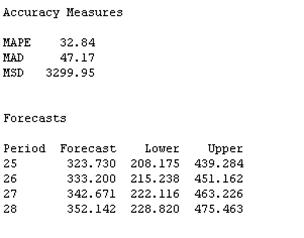
13. Use double exponential smoothing (easiest in Minitab). Run with alpha =.2 and a value of .1 for trend. Note that in Minitab under double exponential smoothing the term “level” is used for alpha and “trend” for trend. Generate forecasts for year 7 quarters 1,2,3 and 4.
Solution: The output generated by Minitab is
14. Suppose sales data for year 7 quarters 1,2,3 and 4 are 262, 392, 321, and 305 respectively. Compare your forecasts from 8,12, and 13 by using mean absolute error. Which method is the best? Now compare your forecasts from 8,12, and 13 by using mean squared error. Which method is the best? Finally, compare your forecasts from 8,12, and 13 by using mean absolute percentage error. Which method is the best?
Solution: We'll put all the forecasts in an Excel table:
|
Season |
Observed |
Time Series |
Multiple Regression |
D. Exponential Smoothing |
|
7/1 |
262 |
297.923912 |
311.03 |
323.73 |
|
7/2 |
392 |
455.847293 |
415.36 |
333.2 |
|
7/3 |
321 |
391.443366 |
371.36 |
342.671 |
|
7/4 |
305 |
222.445362 |
301.52 |
352.142 |
The errors are recorded in the following table
|
Time Series |
Multiple Regression |
D. Exponential Smoothing | |
|
Abs. Mean Error |
63.1923025 |
31.5575 |
47.33575 |
|
Mean Squared Error |
4286.13512 |
1374.467625 |
2490.008326 |
|
Mean Abs. % Error |
19.752765 |
10.37559531 |
15.19213812 |
Remember that your answers should be confined to the first two sheets of paper with supporting computer printout attached in back of the two pages. Your answers must be on the first two pages and must be in sufficient detail. An answer of “see appendix page x” will receive no credit.
Do you have any Minitab questions? Send us your Minitab problems for a Free Quote. We will be back shortly with our very competitive quote. So, it costs you NOTHING to find out how much would it be to get step-by-step solutions to your Stats homework problems.