Use SPSS To Conduct Non-Parametric Tests - SPSS Help
Our main purpose is to examine the effects of Gender and Income on the frequency of visits to the popular North American hamburger chain, McDonald’s for its Bloomingdale location. We recorded the following variables in our database:
- Frequency (Number of visits to McDonalds)
- Income: It is recorded in its raw form, and then it's codified into categories:
2: 25 – 49K
3: 50 – 74K
4: 75K and above
- Gender: Female = 1, Male = 2
The raw dataset is shown below:
|
We can provide you with the SPSS Help you need, at any level!
Get professional graphs, tables, syntax, and fully completed SPSS projects, with meaningful interpretations and write up, in APA or any format you prefer. Whether it is for a Statistics class, Business Stats class, a Thesis or Dissertation, you'll find what you are looking for with us Our service is convenient and confidential. You will get excellent quality SPSS help for you. Our rate starts at $35/hour. Free quote in hours. Quick turnaround! |
|
Frequency |
Gender |
Income |
Frequency |
Gender |
Income |
|
1 |
Man |
24 |
1 |
Woman |
64 |
|
1 |
Man |
32 |
1 |
Woman |
68 |
|
1 |
Man |
33 |
1 |
Woman |
68 |
|
1 |
Man |
63 |
1 |
Woman |
68 |
|
1 |
Man |
71 |
1 |
Woman |
94 |
|
1 |
Man |
79 |
2 |
Woman |
30 |
|
1 |
Man |
86 |
2 |
Woman |
30 |
|
2 |
Man |
20 |
2 |
Woman |
30 |
|
2 |
Man |
33 |
2 |
Woman |
32 |
|
2 |
Man |
39 |
2 |
Woman |
34 |
|
2 |
Man |
39 |
2 |
Woman |
60 |
|
2 |
Man |
61 |
2 |
Woman |
60 |
|
2 |
Man |
61 |
2 |
Woman |
61 |
|
2 |
Man |
62 |
2 |
Woman |
62 |
|
2 |
Man |
65 |
2 |
Woman |
64 |
|
2 |
Man |
65 |
2 |
Woman |
69 |
|
2 |
Man |
67 |
2 |
Woman |
72 |
|
2 |
Man |
69 |
2 |
Woman |
75 |
|
2 |
Man |
70 |
2 |
Woman |
78 |
|
2 |
Man |
71 |
2 |
Woman |
84 |
|
2 |
Man |
76 |
3 |
Woman |
22 |
|
2 |
Man |
78 |
3 |
Woman |
36 |
|
2 |
Man |
84 |
3 |
Woman |
38 |
|
3 |
Man |
22 |
3 |
Woman |
44 |
|
3 |
Man |
26 |
3 |
Woman |
50 |
|
3 |
Man |
31 |
3 |
Woman |
53 |
|
3 |
Man |
39 |
3 |
Woman |
53 |
|
3 |
Man |
40 |
3 |
Woman |
56 |
|
3 |
Man |
44 |
3 |
Woman |
58 |
|
3 |
Man |
49 |
3 |
Woman |
62 |
|
3 |
Man |
52 |
3 |
Woman |
65 |
|
3 |
Man |
53 |
3 |
Woman |
66 |
|
3 |
Man |
55 |
3 |
Woman |
66 |
|
3 |
Man |
63 |
3 |
Woman |
69 |
|
3 |
Man |
65 |
3 |
Woman |
74 |
|
3 |
Man |
69 |
3 |
Woman |
85 |
|
3 |
Man |
69 |
3 |
Woman |
86 |
|
3 |
Man |
76 |
4 |
Woman |
32 |
|
3 |
Man |
77 |
4 |
Woman |
32 |
|
3 |
Man |
78 |
4 |
Woman |
43 |
|
3 |
Man |
93 |
4 |
Woman |
45 |
|
4 |
Man |
27 |
4 |
Woman |
47 |
|
4 |
Man |
30 |
4 |
Woman |
51 |
|
4 |
Man |
33 |
4 |
Woman |
51 |
|
4 |
Man |
34 |
4 |
Woman |
52 |
|
4 |
Man |
36 |
4 |
Woman |
52 |
|
4 |
Man |
36 |
4 |
Woman |
58 |
|
4 |
Man |
44 |
4 |
Woman |
60 |
|
4 |
Man |
48 |
4 |
Woman |
64 |
|
4 |
Man |
51 |
4 |
Woman |
71 |
|
4 |
Man |
54 |
4 |
Woman |
75 |
|
4 |
Man |
55 |
4 |
Woman |
78 |
|
4 |
Man |
56 |
5 |
Woman |
46 |
|
4 |
Man |
56 |
5 |
Woman |
48 |
|
4 |
Man |
58 |
5 |
Woman |
49 |
|
4 |
Man |
59 |
5 |
Woman |
53 |
|
4 |
Man |
62 |
5 |
Woman |
54 |
|
4 |
Man |
63 |
5 |
Woman |
58 |
|
4 |
Man |
63 |
6 |
Woman |
46 |
|
4 |
Man |
64 |
6 |
Woman |
47 |
|
4 |
Man |
64 |
6 |
Woman |
47 |
|
4 |
Man |
65 |
6 |
Woman |
48 |
|
4 |
Man |
65 |
6 |
Woman |
49 |
|
4 |
Man |
66 |
6 |
Woman |
49 |
|
4 |
Man |
70 |
6 |
Woman |
50 |
|
5 |
Man |
48 |
6 |
Woman |
51 |
|
5 |
Man |
49 |
6 |
Woman |
52 |
|
5 |
Man |
49 |
6 |
Woman |
56 |
|
5 |
Man |
53 |
6 |
Woman |
58 |
|
6 |
Man |
45 |
|||
|
6 |
Man |
48 |
|||
|
6 |
Man |
49 |
|||
|
6 |
Man |
50 |
|||
|
6 |
Man |
52 |
|||
|
6 |
Man |
52 |
|||
|
6 |
Man |
52 |
|||
|
6 |
Man |
53 |
|||
|
6 |
Man |
55 |
|||
|
6 |
Man |
59 |
INFLUENCE OF GENDER OVER FREQUENCY:
We need to test the following hypotheses:
\[\begin{align} & {{H}_{0}}:\text{ Gender and Frequency are independent} \\ & {{H}_{A}}:\text{ Gender and Frequency are NOT}\text{ independent} \\ \end{align}\]We'll use a crosstab and the Chi-Square test. The analysis makes sense since both variables are categorical.
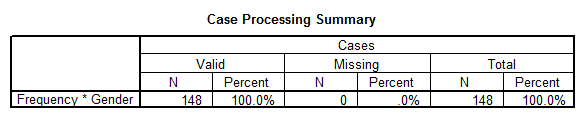
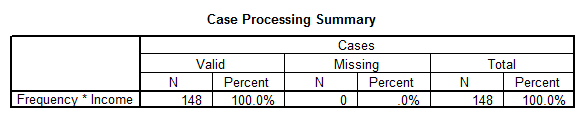
We have the following summary of the analysis.
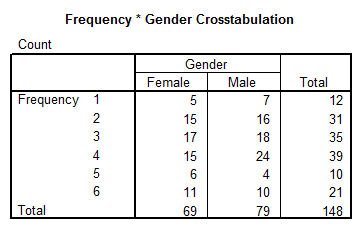
- The crosstab between Frequency and Gender is shown below:
- The results of the Chi-Square Test are shown below:
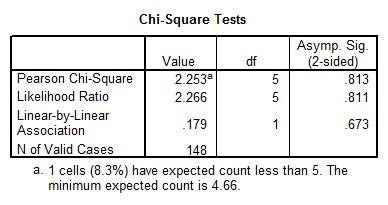
The significance of the test is
\[p=0.813\]
Since the p-value is not less than 0.05, we fail to reject the null hypothesis of independence. This means that we don't have enough evidence to claim that the variables Frequency and Gender are not independent.
- Other measures of association:
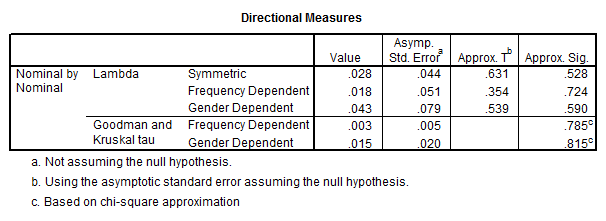
The values of the significances (greater than 0.05) and the low values of the directional measures confirm the lack of association between Gender and Frequency.
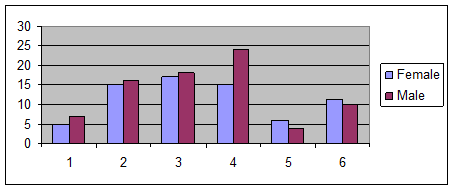
We see the results found with StaTtool:
|
Original Counts |
Female |
Male |
Total |
|
1 |
5 |
7 |
12 |
|
2 |
15 |
16 |
31 |
|
3 |
17 |
18 |
35 |
|
4 |
15 |
24 |
39 |
|
5 |
6 |
4 |
10 |
|
6 |
11 |
10 |
21 |
|
Total |
69 |
79 |
148 |
|
Percentage of Rows |
Female |
Male |
|
|
1 |
41.67% |
58.33% |
100.00% |
|
2 |
48.39% |
51.61% |
100.00% |
|
3 |
48.57% |
51.43% |
100.00% |
|
4 |
38.46% |
61.54% |
100.00% |
|
5 |
60.00% |
40.00% |
100.00% |
|
6 |
52.38% |
47.62% |
100.00% |
|
Percentage of Columns |
Female |
Male |
|
1 |
7.25% |
8.86% |
|
2 |
21.74% |
20.25% |
|
3 |
24.64% |
22.78% |
|
4 |
21.74% |
30.38% |
|
5 |
8.70% |
5.06% |
|
6 |
15.94% |
12.66% |
|
100.00% |
100.00% |
|
Expected Counts |
Female |
Male |
|
1 |
5.5946 |
6.4054 |
|
2 |
14.4527 |
16.5473 |
|
3 |
16.3176 |
18.6824 |
|
4 |
18.1824 |
20.8176 |
|
5 |
4.6622 |
5.3378 |
|
6 |
9.7905 |
11.2095 |
|
Distance from Expected |
Female |
Male |
|
1 |
0.0632 |
0.0552 |
|
2 |
0.0207 |
0.0181 |
|
3 |
0.0285 |
0.0249 |
|
4 |
0.5570 |
0.4865 |
|
5 |
0.3839 |
0.3353 |
|
6 |
0.1494 |
0.1305 |
|
Chi-Square Statistic |
|
|
Chi-Square |
2.2533 |
|
p-Value |
0.8131 |
Finally we show a histogram of the frequency of each category, for each gender:
INFLUENCE OF INCOME OVER FREQUENCY:
We need to test the following hypotheses:
\[\begin{align} & {{H}_{0}}:\text{ Gender and Frequency are independent} \\ & {{H}_{A}}:\text{ Gender and Frequency are NOT}\text{ independent} \\ \end{align}\]- We'll use again a crosstabulation and the Chi-Square test. We have the following summary of the analysis.
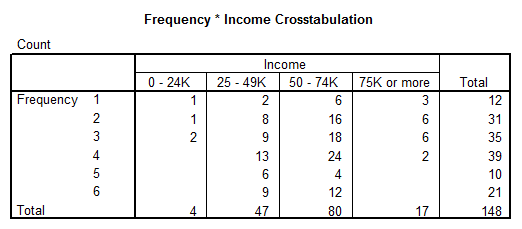
- The crosstab between Frequency and Income is shown below:
- The results of the Chi-Square Test are shown below:
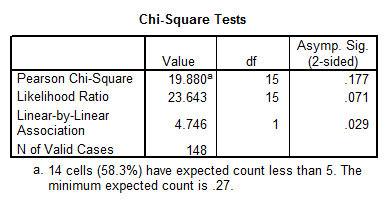
The significance of the test is
\[p=0.177\]
Since the p-value is not less than 0.05, we fail to reject the null hypothesis of independence. This means that we don't have enough evidence to claim that the variables Frequency and Income are not independent.
- Other measures of association: In this case both variables are ordinal, therefore, we can get some different statistics.
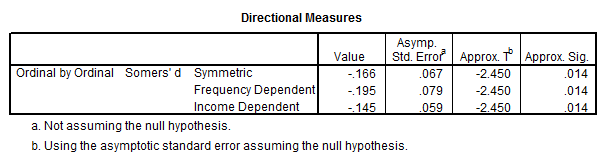
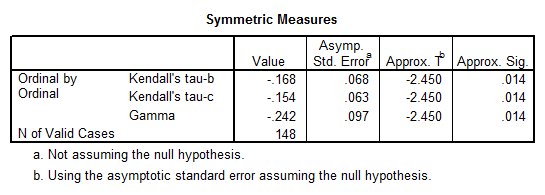
Even though the Chi-Square test showed not enough evidence of dependence between the variables, the significances for the Directional Measures and the Symmetric measures are less than 0.05, which indicates a certain degree of association. But the low values of the statistics show a rather weak of association between Income and Frequency.
- Now we show the work with StaTtool
|
Original Counts |
Income 1 |
Income 2 |
Income 3 |
Income 4 |
Total |
|
1 |
1 |
2 |
6 |
3 |
12 |
|
2 |
1 |
8 |
16 |
6 |
31 |
|
3 |
2 |
9 |
18 |
6 |
35 |
|
4 |
0 |
13 |
24 |
2 |
39 |
|
5 |
0 |
6 |
4 |
0 |
10 |
|
6 |
0 |
9 |
12 |
0 |
21 |
|
Total |
4 |
47 |
80 |
17 |
148 |
|
Percentage of Rows |
Income 1 |
Income 2 |
Income 3 |
Income 4 |
|
|
1 |
8.33% |
16.67% |
50.00% |
25.00% |
100.00% |
|
2 |
3.23% |
25.81% |
51.61% |
19.35% |
100.00% |
|
3 |
5.71% |
25.71% |
51.43% |
17.14% |
100.00% |
|
4 |
0.00% |
33.33% |
61.54% |
5.13% |
100.00% |
|
5 |
0.00% |
60.00% |
40.00% |
0.00% |
100.00% |
|
6 |
0.00% |
42.86% |
57.14% |
0.00% |
100.00% |
|
Percentage of Columns |
Income 1 |
Income 2 |
Income 3 |
Income 4 |
|
1 |
25.00% |
4.26% |
7.50% |
17.65% |
|
2 |
25.00% |
17.02% |
20.00% |
35.29% |
|
3 |
50.00% |
19.15% |
22.50% |
35.29% |
|
4 |
0.00% |
27.66% |
30.00% |
11.76% |
|
5 |
0.00% |
12.77% |
5.00% |
0.00% |
|
6 |
0.00% |
19.15% |
15.00% |
0.00% |
|
100.00% |
100.00% |
100.00% |
100.00% |
|
Expected Counts |
Income 1 |
Income 2 |
Income 3 |
Income 4 |
|
1 |
0.3243 |
3.8108 |
6.4865 |
1.3784 |
|
2 |
0.8378 |
9.8446 |
16.7568 |
3.5608 |
|
3 |
0.9459 |
11.1149 |
18.9189 |
4.0203 |
|
4 |
1.0541 |
12.3851 |
21.0811 |
4.4797 |
|
5 |
0.2703 |
3.1757 |
5.4054 |
1.1486 |
|
6 |
0.5676 |
6.6689 |
11.3514 |
2.4122 |
|
Distance from Expected |
Income 1 |
Income 2 |
Income 3 |
Income 4 |
|
1 |
1.4077 |
0.8605 |
0.0365 |
1.9078 |
|
2 |
0.0314 |
0.3456 |
0.0342 |
1.6709 |
|
3 |
1.1745 |
0.4024 |
0.0446 |
0.9749 |
|
4 |
1.0541 |
0.0305 |
0.4042 |
1.3726 |
|
5 |
0.2703 |
2.5118 |
0.3654 |
1.1486 |
|
6 |
0.5676 |
0.8148 |
0.0371 |
2.4122 |
|
Chi-Square Statistic |
|
|
Chi-Square |
19.8800 |
|
p-Value |
0.1766 |
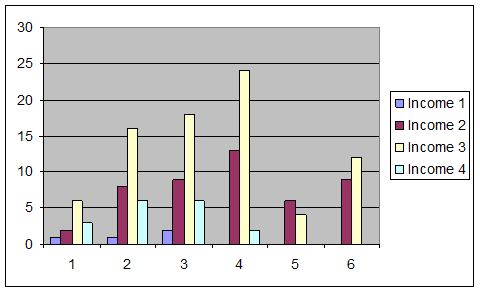
Finally we show a histogram of the frequency of each category, for each Income Category:
|
We provide SPSS Help for Students, at any level!
Get professional graphs, tables, syntax, and fully completed SPSS projects, with meaningful interpretations and write up, in APA or any format you prefer. Whether it is for a Statistics class, Business Stats class, a Thesis or Dissertation, you'll find what you are looking for with us Our service is convenient and confidential. You will get excellent quality SPSS help for you. Our rate starts at $35/hour. Free quote in hours. Quick turnaround! |
You can send you Stats homework problems for a Free Quote. We will be back shortly (sometimes within minutes) with our very competitive quote. So, it costs you NOTHING to find out how much would it be to get step-by-step solutions to your Stats homework problems.
Our experts can help YOU with your Stats. Get your FREE Quote. Learn about our satisfaction guaranteed policy: If you're not satisfied, we'll refund you. Please see our terms of service for more information about this policy.